Trash Reduction Plan
What is the Trash Reduction Plan?
The Hawai’i Department of Transportation (HDOT), O’ahu District developed and submitted a Trash Reduction Plan in October 2016, to satisfy parts of its Municipal Separate Storm Sewer System (MS4) National Pollutant Discharge Elimination System (NDPES) Permit.
The Trash Reduction Plan aims to reduce trash discharged from the MS4, or storm water network connected to the island’s highways, and the associated impacts on receiving State waterbodies.
This map shows the watersheds that trash loads from our highways have the potential to negatively impact. Watersheds that are currently identified as trash impaired are highlighted in red.
Use the search bar at the top of the map to the left to find out if you live in a trash-impaired watershed.
How much trash is on the highways?
The first step to tackling trash on our highways was to figure out the Trash Baseline Load, or the quantity of trash making it onto the roads.
To calculate the Trash Baseline Load, a literature review and a Trash Characterization Study was combined to identify and assign trash loading rates to eight key land-uses present in the HDOT jurisdictional area, or right-of-way (ROW). These land-uses include:
- Mixed Use
- Agriculture
- Commercial
- High Density Residential
- Industrial
- Low Density Residential
- Medium Density Residential
- Park Land
Use the map to the right or click the link below to view the different land-uses present on O’ahu.
Trash Characterization Study
The Trash Characterization Study looked more closely at the three most prevalent land-uses in HDOT ROW: Agriculture, Park Land, and Residential High Density. This data helped us quantify and characterize the types of trash generated from these land-uses.
10 sites were selected within HDOT ROW. Traps were installed in open channels to collect trash and organic debris. The collected debris was sorted and analyzed after significant rainfall events or within 90 days.
Combined with the data from the literature review, our study concluded that all eight land-use classes produce an estimated Trash Baseline Load totaling 297 cubic yards per year.
Click on different trash trap locations on the map to view the types of trash characterized at each site.
What does HDOT do to prevent trash from entering our waters?
MS4 Interception Control Measures
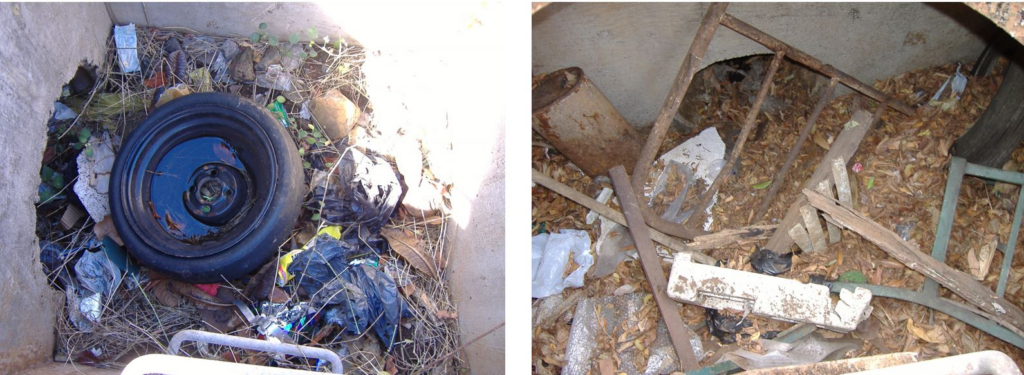
MS4 cleanings capture and remove large amounts of pollutants from our MS4. Take a look at these pictures to see some of the debris that end up in our storm drains.
View the map on the right to see our MS4 trash hotspots. The map compiles data from our MS4 cleaning events and depicts structures with high levels of trash and debris in red and structures with low levels of trash and debris in green.
In addition to cleanings, Post Construction Best Management Practices, or Post Construction BMPs, also help address the trash and debris. Post Construction BMPs are structural devices that are engineered to keep trash and other pollutants out of our MS4.
Institutional Control Measures
As part of the Public Education Program, HDOT actively engages school-aged children through school presentations and regularly attends local outreach events that provide opportunities for hands-on learning and fun educational experiences for all.
Land-Based Interception Control Measures
HDOT implements an Adopt-A-Highway program and a street sweeping program to collect trash on the surface of roads and surrounding sidewalks. Adopt-A-Highway volunteer groups agree to adopt a two-mile portion of roadway and collect trash on the sidewalk and surrounding green areas. Street sweeping focuses on the removal of trash, leaves, and other large debris on the roadway.
Visual Trash Assessment
After the submission of the Trash Reduction Plan, HDOT implemented a Visual Trash Assessment. This assessment provided a rapid method to qualitatively estimate trash conditions along HDOT routes.
The entire HDOT ROW was divided into 1-mile segments. The Visual Trash Assessment team evaluated each segment and assigned it with a trash level of low, moderate, or high. The type of trash and possible sources of pollution were also noted to help guide the implementation of future control measures.
The Visual Tash Assessment is conducted at least once per year. The maps below show the results from the trash data collected in 2017 versus the trash data collected in 2023. As you can see, we have made a lot of improvement from the first assessment, largely due to our control measures in place.
Click on a Visual Trash Assessment segment in the maps below to view the trash data collected in 2017 (left) and 2023 (right).
How will HDOT decrease the amount of trash discharged to surrounding waters?
HDOT is working hard to effectively enhance and implement existing practices to reduce the pollution to waterbodies.
Below are a few examples of activities and practices put in place with the Trash Reduction Plan:
- Designed and constructed more than 10 new Permanent BMPs in impaired waterbodies
- Conducted a pilot study to assess the effects of increased street sweeping in impaired waterbodies
- Did you see our PSAs on TV? This enhances our Public Education Program and specifically targets trash reduction island-wide!

Time Matters
Everyday, all of us take a journey – to the office, to the gym, or to meet a friend. If you had a coffee or energy bar along the way, it may be tempting to toss the wrapper or empty cup before you get to your destination.
But holding on to it for just a few moments until you can dispose of it properly can make a world of difference – especially for our environment.